Capture consistent data
Use shared menu, order and location definitions.

Restaurant managers do not need more charts. They need clearer answers.
Which items are actually driving sales? Which service periods are changing?
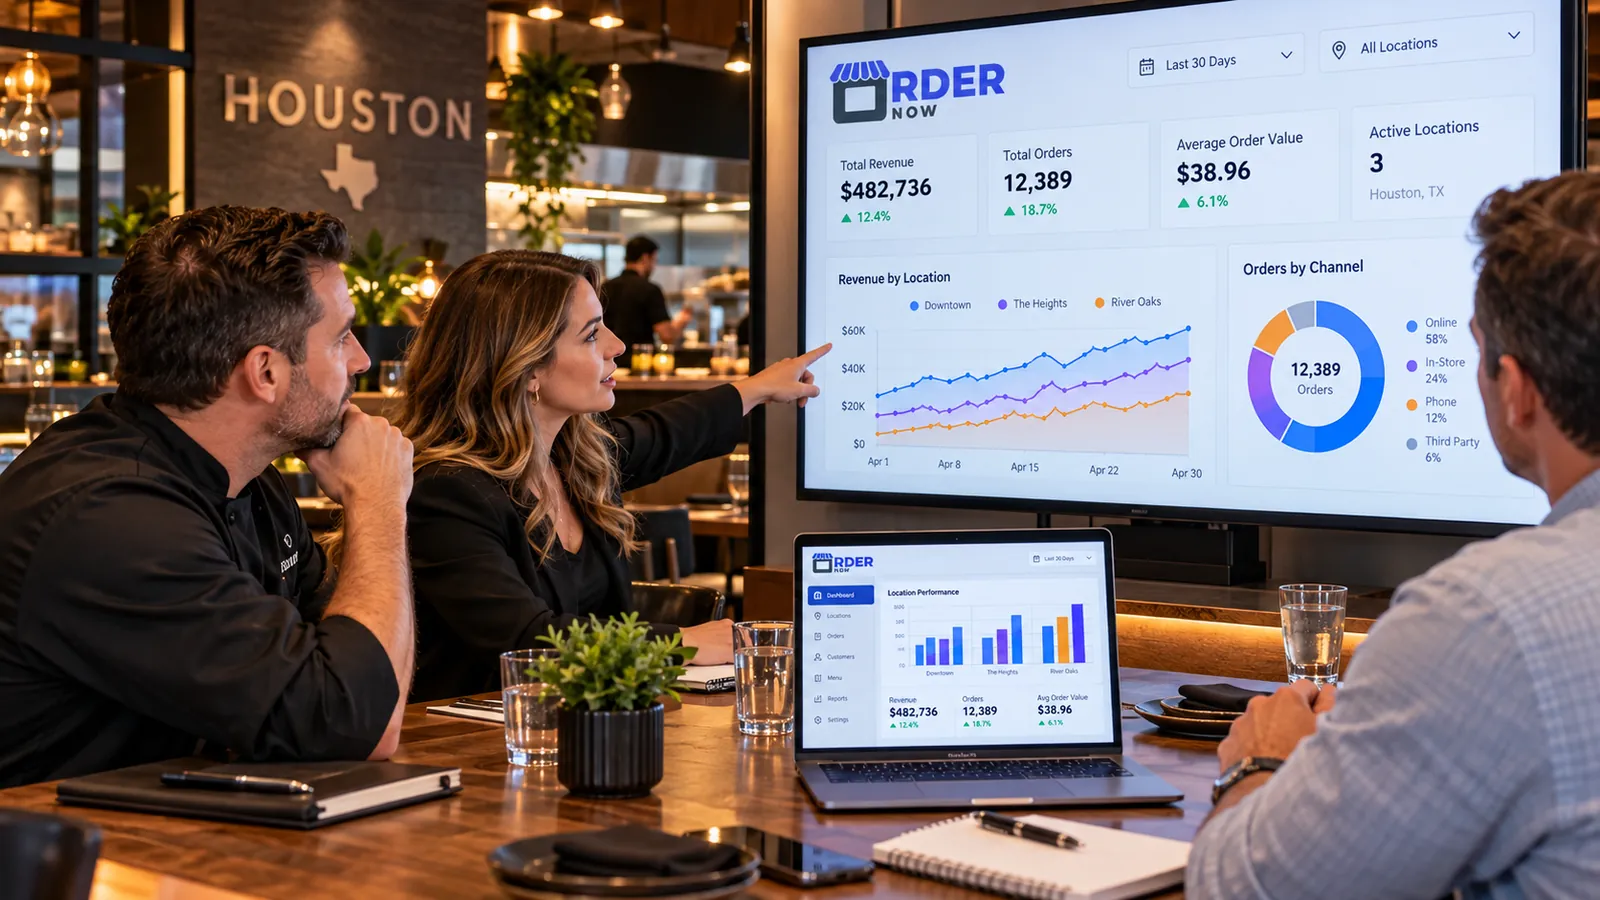
Restaurant analytics software organizes restaurant operating data into reports and dashboards that help managers understand sales, menu performance, order patterns and business trends. A useful analytics system should make data easier to compare without pretending that a chart can explain every cause by itself. Restaurant analytics is different from bookkeeping. Accounting answers important questions about financial records, tax, liabilities and profit. Restaurant operational analytics focuses more closely on what happened inside service: which items sold, when demand occurred, how order channels behaved and how locations compare.
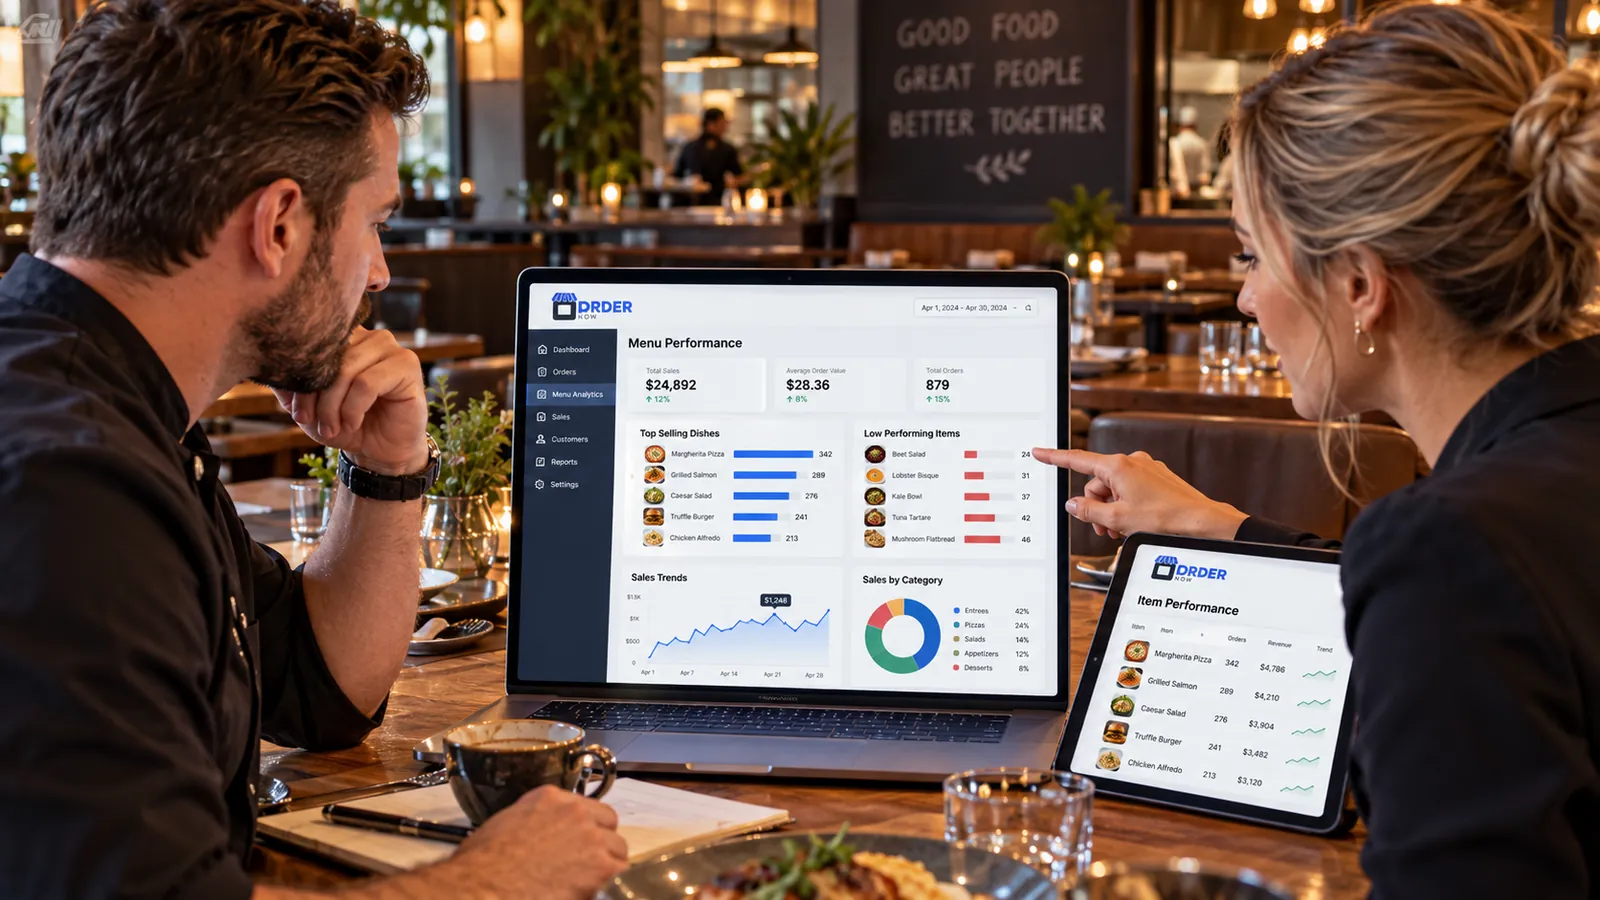
Keep the process understandable for guests and staff while carrying the details the operation actually needs.
Use shared menu, order and location definitions.
Review like-for-like days, service periods and outlets.
Spot item, channel or location patterns worth investigating.
Make one operational change, then review whether it improved the result.

OrderNow is modular. The strongest setup is not the one with the most features switched on. It is the one that removes unnecessary handoffs and keeps the team clear about what happens next.
A dashboard full of numbers can still create poor decisions if management has not defined the question.
A daily sales total is useful, but it becomes more useful when managers can compare it with time, order types and menu activity.
Menu-item reporting is one of the most practical uses of restaurant analytics.
Restaurants increasingly operate more than one ordering workflow.
Group-level analytics is valuable because it allows operators to see the business at two levels: the network and the individual outlet.
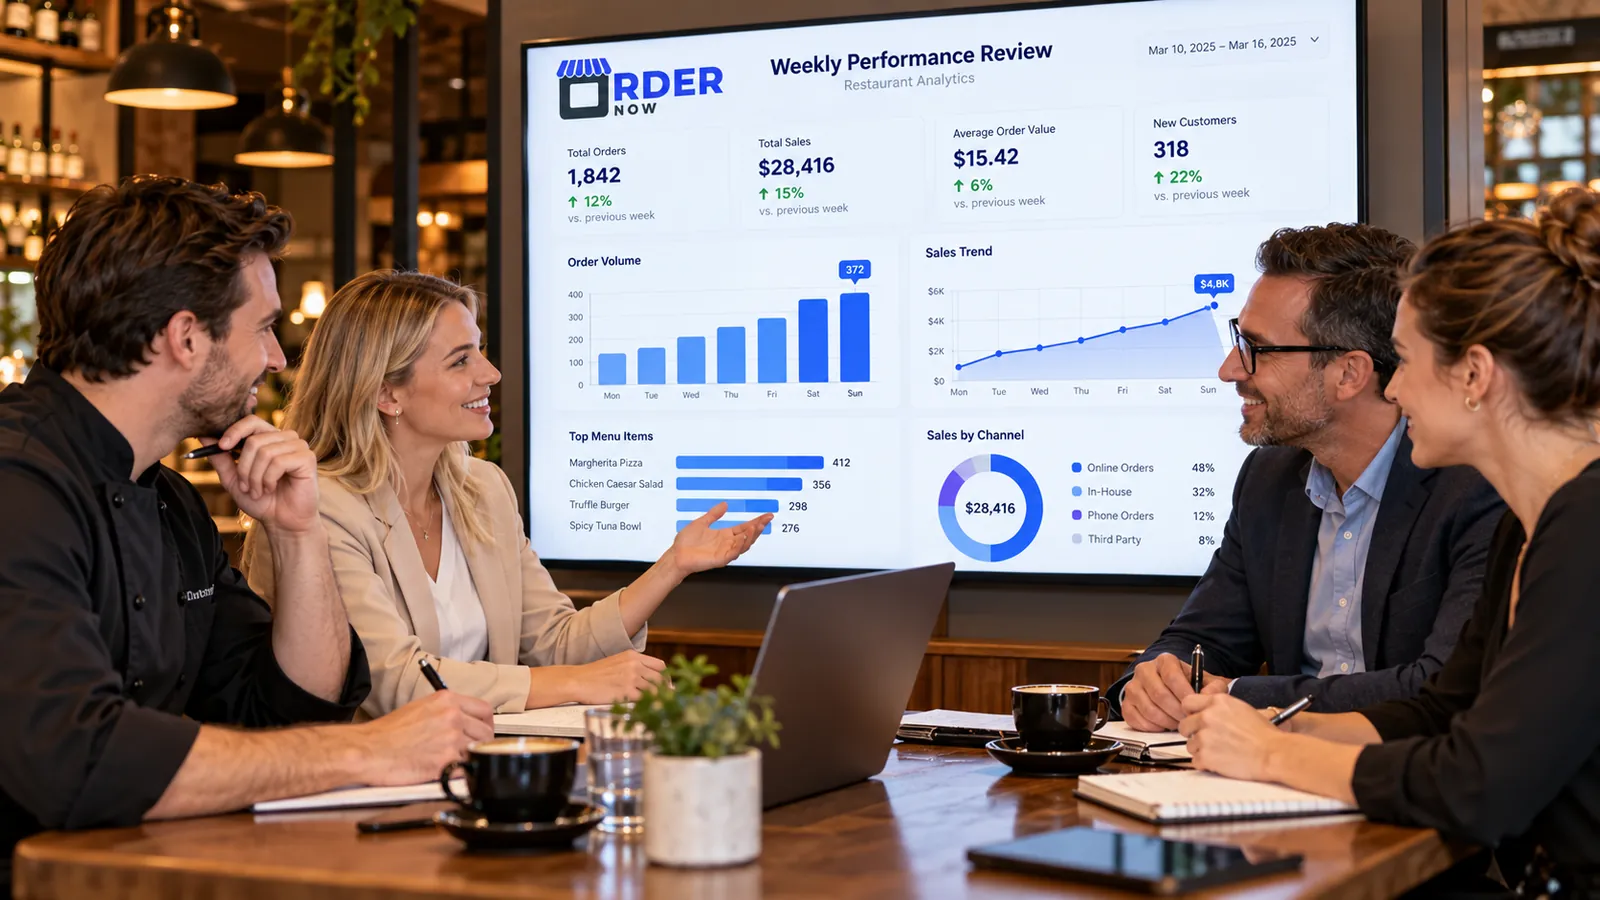
Analytics becomes more useful when the management team reviews it on a schedule.
Bring the management questions you already ask every week. Verify that the available reports can answer them with consistent item, order-channel, time-period and location data.
The goal is not a larger dashboard. The goal is a smaller set of reliable measures that change menu, staffing, purchasing, promotion or operational decisions.
Different restaurant formats need different combinations of guest experience, POS, kitchen, inventory and management controls.
Focus on a compact view of sales, items and order activity that supports weekly decisions without requiring a dedicated analyst.
Use daily and weekly reports to identify service issues, promotions, item trends and operational exceptions.
Combine item demand with recipe and prep knowledge to understand which menu choices are helping or hurting execution.
Compare outlets, then investigate local context instead of managing by ranking alone.
These answers stay intentionally concise. Product configuration can vary by plan, restaurant type and implementation.
Restaurant analytics software organizes restaurant sales and operational data into reports and dashboards so managers can understand performance, identify trends and make more informed operating decisions.
Useful dashboards commonly show sales, item performance, order activity, time trends and location comparisons. The right dashboard depends on the decisions the restaurant needs to make.
Yes. Multi-location configurations can provide location-level and group-level reporting so operators can compare outlets while still reviewing each branch individually.
No. Restaurant operational analytics and accounting solve different problems. OrderNow reporting helps managers understand platform activity, while accounting systems manage broader financial records and compliance.
Yes. Item-level sales reporting can help managers identify high-volume items and trends. For profitability analysis, combine sales information with recipe and cost data.
Share your business type, current setup and the operational problem you want to solve. The demo should start with that workflow instead of showing every module.